Buy Data
Race & Strategy Analysis
Full stint breakdowns (fuel usage, tire wear, pace fade)
Undercut & overcut success modeling
Pitstop efficiency and strategy optimization
Safety car / VSC impact projections
Opponent behavior trends and team strategy prediction
Telemetry Insights
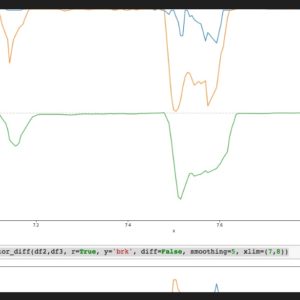
Throttle, brake, steering input charts
Gear usage and shifting patterns
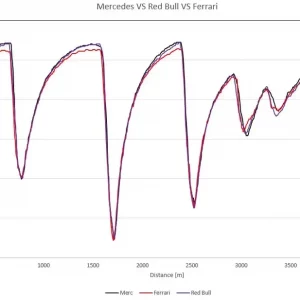
Speed traces and delta comparisons
Corner entry/exit behavior
Suspension travel & load transfer (if available)
Lap Time & Sector Analysis
Ideal lap calculation
Delta comparisons between drivers / setups
Sector-by-sector performance breakdown
Consistency scoring (std. deviation per lap)
Time gain/loss visualizations
Tire & Fuel Data
Compound-specific wear curves
Long run degradation modeling
Optimal pit windows based on fuel load
Tire pressure & temperature recommendations
Driver Profiling
Error rate & incident heatmap
Consistency index
Adaptive driving style changes during race
Pressure response (laps under attack vs clean air)
Driver vs driver battle performance
Track-Specific Intelligence
Track evolution & grip trend by session
Setup adjustment suggestions based on data
Hotspot zones (where most overtakes or errors occur)
Weather-adjusted performance projections (if applicable)
Predictive Modeling
Finishing position probability engine
Qualifying vs Race performance prediction
Opponent risk & reliability models
Scenario simulations (e.g., early pitstop / late safety car)
Data Formats & Delivery
Available in CSV, Excel, or JSON
API integration possible (for premium clients)
Custom dashboards (via Tableau or PowerBI)
Weekly or race-by-race reports
Optional voice/video debrief sessions with our analysts


Get in Touch with Us for the Best Quality Sports Data.


